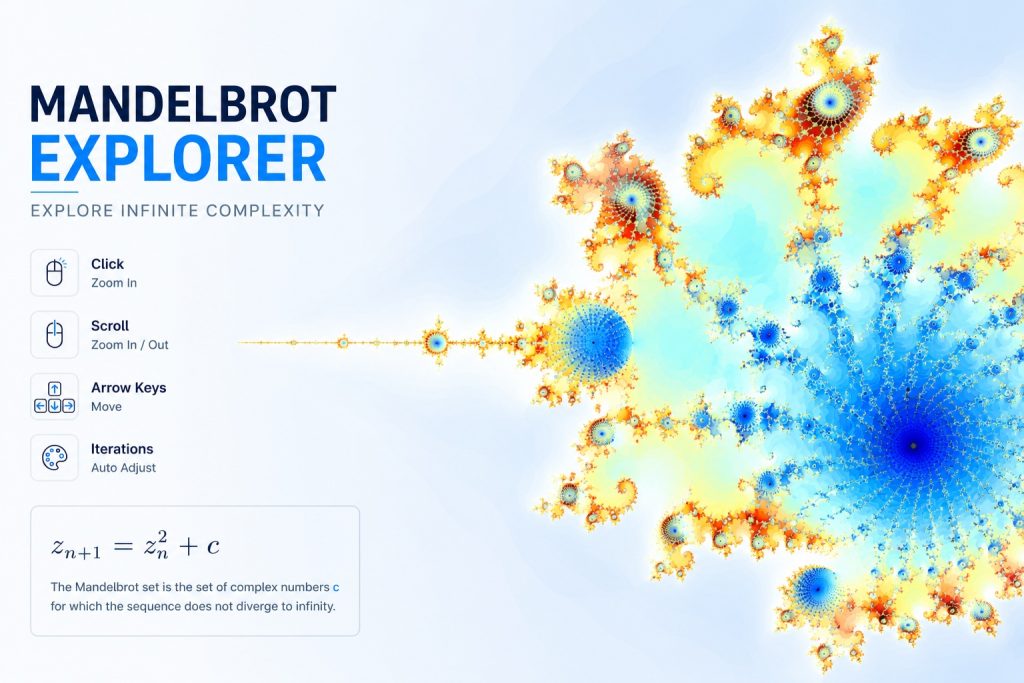
The website can be found at the following location: www.fractals.ovh
As a teenager learning about mathematics and computers I read in a popular scientific magazine about fractals and Lorentz attractors. The beautiful fractals and my intrest in computers triggered me to develop a software that could draw fractals. On my 8088 CPU at that time the computation was awfully slow but it worked and I found it fascinating. It was a reason to me to read more about chaos theory in mathematics.
So now I decided to make a dynamic website about this intruiging mathemical phenomen. With only HTML, a canvas element, and vanilla JavaScript, it is possible to explore a mathematical object that contains infinite complexity.
This project started as an experiment in low level browser graphics and mathematical visualization. The goal was simple: render the Mandelbrot set in real time and allow interactive exploration without external libraries, frameworks, or dependencies.
Historical background
The roots: early 1900s, Julia and Fatou
Around 1917–1920, two French mathematicians, Gaston Julia and Pierre Fatou, were studying what happens when you repeatedly apply a function to itself. Iterating something like z → z² + c over and over, feeding each output back in as the next input. They wanted to understand the long-term behavior of these iterations: does a starting point spiral toward a fixed value, orbit periodically, or fly off to infinity?
This was pure theoretical math. They had no computers, so they worked it out with pencil, paper, and a lot of abstract analysis. The sets of points with “interesting” behavior under this kind of iteration are now called Julia sets in his honor. It was a niche, mostly-forgotten corner of mathematics for decades, nobody could actually see what these sets looked like, because computing thousands of iterations by hand for thousands of points is essentially impossible.
The 1970s–80s: Mandelbrot and computers
Benoit Mandelbrot, working at IBM, had access to something Julia and Fatou didn’t: computers that could brute-force these iterations fast. He started plugging in different values of c and rendering the results as images.
He noticed something remarkable: for the family of functions z → z² + c, the shape of the Julia set depends on which value of c you pick. Some values give a connected, blob-like Julia set; others give a Julia set that’s shattered into infinite disconnected dust.
So he asked a clever meta-question: instead of just picking one c and drawing its Julia set, what if he made a map of all the c values themselves, colored by whether that particular c produces a connected Julia set or not? That map is the Mandelbrot set, the picture your code is generating. Each point c in it is really asking “if I used this c as the constant in Julia’s formula, would I get a nice connected shape or a scattered mess?”
He published this in the early 1980s, and it became one of the first mathematical objects widely recognized as “beautiful” by the public, partly because computers had finally caught up to the math. It’s also a classic example of a fractal, Mandelbrot himself coined that term, because the boundary has infinite detail: zoom into any edge and you keep finding smaller copies of the same swirling structures, forever.
Solution Architecture: How the Explorer Is Built
Then briefly explain the three layers:
HTML
The HTML structure is intentionally small. It contains the canvas used for rendering the fractal and a few interface elements for displaying the current zoom level, coordinates, and iteration settings.
CSS
CSS controls the page layout and keeps the canvas responsive. The visual design is separated from the rendering logic, so changes to the page styling do not affect the mathematical calculations.
JavaScript
JavaScript performs the actual Mandelbrot calculations. Each canvas pixel is converted into a complex coordinate. The iterative formula is evaluated until the value escapes or reaches the maximum iteration count. The resulting iteration count determines the pixel colour before it is rendered on the canvas.
What the Mandelbrot set is
The Mandelbrot set is a collection of complex numbers for which a simple iterative formula does not diverge to infinity. The formula itself is deceptively minimal:
zₙ₊₁ = zₙ² + c
Despite its simplicity, the resulting structure reveals endless detail. No matter how deep you zoom, new patterns continue to appear. This property makes the Mandelbrot set a perfect demonstration of emergent complexity and deterministic chaos.
From a software perspective, it is also a great way to understand how numerical computation, performance, and rendering interact inside a browser.
Why Canvas and Vanilla JavaScript
This explorer is implemented using the HTML canvas API and plain JavaScript, also known as Vanilla JavaScript. The HTML canvas element has several methods for drawing paths, boxes, circles and text, as well as adding images. Canvas is supported by all major browsers.
This approach provides control over:
- coordinate transformations
- zoom behavior
- iteration depth
- color mapping
- redraw timing
It also keeps the project readable and educational.
Interactive Exploration
The explorer supports multiple interaction modes that make the fractal feel alive.
Mouse click recenters the view and zooms in
Mouse wheel smoothly zooms in and out
Arrow keys allow precise navigation
Iteration depth increases with zoom to preserve detail
Each interaction triggers a full redraw of the canvas, recalculating every pixel based on the new parameters. While this is computationally expensive, it highlights how far modern browsers have come in raw JavaScript performance.
Coloring and Visual Feedback
Pixels that never escape the iteration limit are rendered black. All other pixels are colored using an HSL based color scheme where the hue depends on the number of iterations before escape.
A subtle hue offset animation is applied between redraws, giving the fractal a dynamic appearance without altering the underlying mathematics.
This technique makes structural boundaries more visible and enhances depth perception when zooming.
What This Project Demonstrates
Although visually appealing,it demonstrates several core software engineering concepts.
- Deterministic algorithms producing complex results
- Numerical stability and floating point limitations
- Performance considerations in nested loops
- Event driven UI logic
- State management without frameworks
It also shows that meaningful interactive software can still be built with fundamental tools, without abstraction layers.
Practical Value Beyond Visuals
Mandelbrot explorers have real world relevance beyond fascination.
- They are commonly used as benchmarks for CPU and GPU performance.
- They serve as teaching tools in mathematics and computer science.
- They illustrate chaos theory and nonlinear systems.
- They are excellent exercises for optimization and parallelization.
For developers, they are a reminder that simplicity and depth can coexist.
Fractals in popular culture
Fractals have also found their way into popular culture.
- In Star Trek II: The Wrath of Khan from 1982, computer generated fractal landscapes were used during the Genesis Effect sequence, an important early example of fractal based imagery in film.
- Aphex Twin and other electronic artists have used fractal inspired imagery in visual performances.
- Games such as No Man’s Sky use procedural generation to create enormous numbers of planets, landscapes and ecosystems. Although procedural generation is not the same as fractal mathematics, both demonstrate how relatively simple rules can produce complex and varied results.
- Fractal patterns are also common in electronic music visuals, psychedelic art, festivals, museums and scientific documentaries. Artists use programs such as Ultra Fractal, Mandelbulb3D and Chaotica to create detailed images based on mathematical formulas.
Can I try it?
The explorer is available online at www.fractals.ovh. Try zooming into different regions of the fractal using the mouse wheel and discover how new structures continue to emerge at every scale.
Future improvements
Planned improvements include support for multiple iterative formulas, making it possible to compare the Mandelbrot set with other fractals and explore how small changes in the mathematics affect the resulting image.