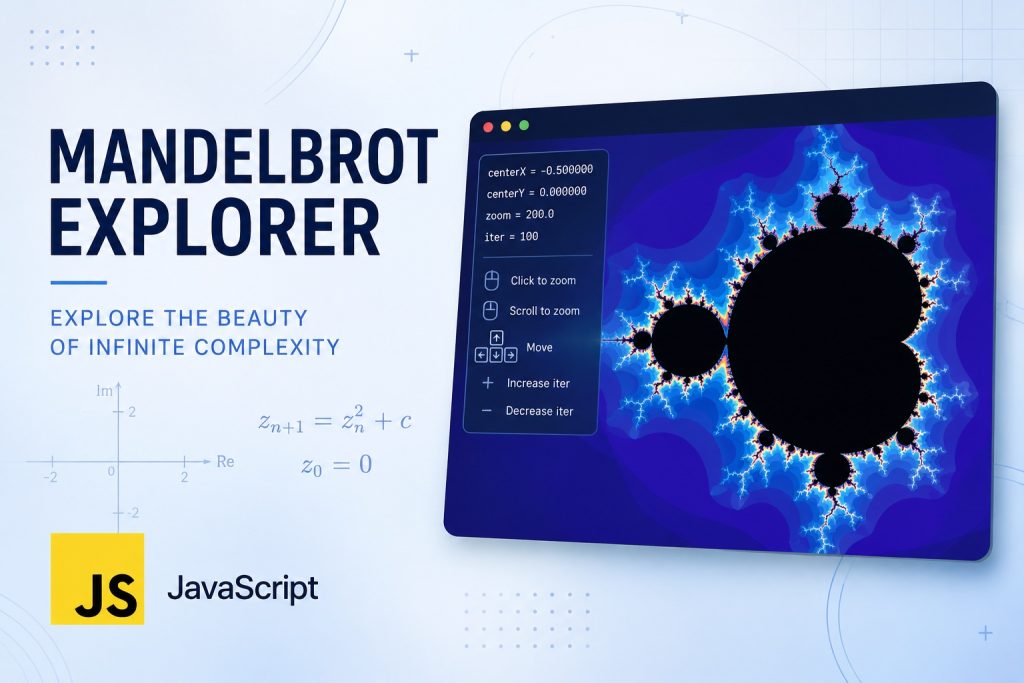
This JavaScript file contains the complete logic for the interactive Mandelbrot Explorer. It initializes the canvas, calculates the Mandelbrot set for every pixel, draws the fractal and allows the user to zoom and navigate using the mouse and keyboard. It forms the core of the website, where the mathematical calculations are performed, the graphical output is rendered and the user interactions are handled.
const canvas = document.getElementById("c");
const ctx = canvas.getContext("2d");
const info = document.getElementById("info");

let centerX = -0.5;
let centerY = 0.0;
let scale = 200;
let maxIter = 100;
let hueOffset = 0;

function draw() {
    hueOffset += 2;

    info.textContent =
        `centerX=${centerX.toFixed(6)}  centerY=${centerY.toFixed(6)}  zoom=${scale.toFixed(1)}  iter=${maxIter}`;

    for (let x = 0; x < canvas.width; x++) {
        for (let y = 0; y < canvas.height; y++) {

            let cx = (x - canvas.width / 2) / scale + centerX;
            let cy = (y - canvas.height / 2) / scale + centerY;

            let zx = 0;
            let zy = 0;
            let i = 0;

            while (zx * zx + zy * zy < 4 && i < maxIter) {
                const tmp = zx * zx - zy * zy + cx;
                zy = 2 * zx * zy + cy;
                zx = tmp;
                i++;
            }

            if (i === maxIter) {
                ctx.fillStyle = "black";
            } else {
                ctx.fillStyle = `hsl(${i * 6 + hueOffset}, 100%, 50%)`;
            }

            ctx.fillRect(x, y, 1, 1);
        }
    }
}

canvas.addEventListener("click", e => {
    const rect = canvas.getBoundingClientRect();
    const x = e.clientX - rect.left;
    const y = e.clientY - rect.top;

    centerX += (x - canvas.width / 2) / scale;
    centerY += (y - canvas.height / 2) / scale;

    scale *= 2;
    maxIter += 20;

    draw();
});

canvas.addEventListener("wheel", e => {
    e.preventDefault();

    scale *= e.deltaY < 0 ? 1.25 : 0.8;

    draw();
});

document.addEventListener("keydown", e => {

    const step = 40 / scale;

    if (e.key === "ArrowUp") centerY -= step;
    if (e.key === "ArrowDown") centerY += step;
    if (e.key === "ArrowLeft") centerX -= step;
    if (e.key === "ArrowRight") centerX += step;

    if (e.key === "+") maxIter += 20;
    if (e.key === "-") maxIter = Math.max(20, maxIter - 20);

    draw();
});

draw();
Getting references to the HTML elements
const canvas = document.getElementById("c");
const ctx = canvas.getContext("2d");
const info = document.getElementById("info");
The first step is to obtain references to the HTML elements.
- canvas refers to the <canvas> element where the fractal will be drawn.
- ctx is the 2D drawing context of the canvas. Every drawing operation, such as drawing pixels, rectangles or text, is performed through this object.
- info refers to the small information box that displays the current coordinates, zoom level and iteration count.
Initial variables
let centerX = -0.5;
let centerY = 0.0;
let scale = 200;
let maxIter = 100;
let hueOffset = 0;
These variables determine the current view of the Mandelbrot set.
- centerX and centerY represent the mathematical coordinates at the centre of the screen.
- scale determines the zoom level. A larger value means a higher zoom.
- maxIter specifies the maximum number of Mandelbrot iterations performed for every pixel.
- hueOffset is used to animate the colours by slowly rotating the colour palette.
Initially, the explorer starts at the traditional centre of the Mandelbrot set.
The draw() function
function draw() {This function redraws the complete fractal every time the user changes something.
Whenever the user zooms, pans or changes the iteration count, this function is called again.
Rotating the colours
hueOffset += 2;Each redraw slightly increases the hue offset.
This shifts the colours around the colour wheel, producing a subtle animation without changing the underlying fractal.
Updating the information box
info.textContent =
    `centerX=${centerX.toFixed(6)}  centerY=${centerY.toFixed(6)}  zoom=${scale.toFixed(1)}  iter=${maxIter}`;
The current position and settings are displayed in the information panel.
toFixed() limits the number of decimal places, making the values easier to read.
For example:
centerX=-0.500000
centerY=0.000000
zoom=200.0
iter=100
Looping over every pixel
for (let x = 0; x < canvas.width; x++) {
    for (let y = 0; y < canvas.height; y++) {
The explorer examines every pixel individually.
The outer loop moves horizontally across the canvas.
The inner loop moves vertically.
Each pixel corresponds to one point in the complex plane.
Converting screen coordinates into mathematical coordinates
let cx = (x - canvas.width / 2) / scale + centerX;
let cy = (y - canvas.height / 2) / scale + centerY;
The canvas uses pixel coordinates.
The Mandelbrot set uses complex numbers.
These formulas convert the screen position into its corresponding mathematical location.
- canvas.width / 2 moves the origin to the centre of the screen.
- Dividing by scale applies the zoom level.
- Adding centerX and centerY shifts the viewing position.
Without this conversion, zooming and panning would not be possible.
Initialising the Mandelbrot calculation
let zx = 0;
let zy = 0;
let i = 0;
The Mandelbrot algorithm always starts at
z = 0where
- zx is the real part
- zy is the imaginary part
i counts how many iterations are required before the point escapes.
The Mandelbrot iteration
while (zx * zx + zy * zy < 4 && i < maxIter) {This loop repeatedly applies the Mandelbrot formula, which lies at the heart of the entire explorer.
The calculation continues while
- the point has not escaped
- the maximum number of iterations has not been reached
The value 4 is used because
|z|² = zx² + zy²and once
|z| > 2the point is guaranteed to escape to infinity.
Applying the Mandelbrot formula
const tmp = zx * zx - zy * zy + cx;
zy = 2 * zx * zy + cy;
zx = tmp;
These three lines implement.
z = z² + cFor complex numbers
z = zx + zy ithe equation becomes
real = zx² − zy² + cx

imaginary = 2 · zx · zy + cy
The temporary variable is necessary because the old value of zx is still needed when calculating zy.
Counting iterations
i++;Each pass through the loop increases the iteration counter.
Points that escape quickly receive a small value.
Points close to the boundary usually require many iterations.
Choosing the colour
if (i === maxIter) {
    ctx.fillStyle = "black";
}
If the point never escaped, it is assumed to belong to the Mandelbrot set.
These points are coloured black.
Otherwise,
ctx.fillStyle =
    `hsl(${i * 6 + hueOffset}, 100%, 50%)`;
The colour depends on the number of iterations.
The HSL colour model is used.
- Hue changes with the iteration count.
- Saturation remains at 100%.
- Brightness remains at 50%.
Multiplying by six spreads the colours nicely across the colour wheel.
Adding hueOffset creates the animated colour cycling.
Drawing the pixel
ctx.fillRect(x, y, 1, 1);A rectangle of size
1 × 1 pixelis drawn.
Since every pixel is drawn individually, the complete fractal gradually appears on the screen.
Zooming with the mouse
canvas.addEventListener("click", e => {Clicking on the canvas zooms into the selected location.
First the mouse position is calculated.
const rect = canvas.getBoundingClientRect();

const x = e.clientX - rect.left;
const y = e.clientY - rect.top;
The mouse coordinates are converted from browser coordinates into canvas coordinates.
The centre of the view is then moved.
centerX += (x - canvas.width / 2) / scale;
centerY += (y - canvas.height / 2) / scale;
Finally,
scale *= 2;
maxIter += 20;
The zoom doubles and the iteration limit increases.
Higher zoom levels require more iterations to preserve detail.
The fractal is then redrawn.
draw();Zooming with the mouse wheel
canvas.addEventListener("wheel", e => {The mouse wheel changes only the zoom level.
e.preventDefault();This prevents the browser from scrolling the page.
The zoom is updated.
scale *= e.deltaY < 0 ? 1.25 : 0.8;If the wheel moves upwards, the image zooms in.
If the wheel moves downwards, the image zooms out.
The fractal is then redrawn.
Keyboard navigation
document.addEventListener("keydown", e => {The keyboard allows movement through the fractal.
const step = 40 / scale;The movement distance depends on the zoom level.
The further you zoom in, the smaller each movement becomes.
The arrow keys move the viewing position.
ArrowUp
ArrowDown
ArrowLeft
ArrowRight
The plus and minus keys adjust the maximum iteration count.
if (e.key === "+") maxIter += 20;

if (e.key === "-")
    maxIter = Math.max(20, maxIter - 20);
The minimum iteration count is limited to 20.
After every key press, the fractal is redrawn.
Drawing the first image
draw();The final line starts the entire application.
Without this call, nothing would appear on the canvas until the user interacted with the page.
Once draw() runs, the explorer calculates every pixel, renders the Mandelbrot set, and waits for mouse and keyboard input to let the user explore the infinite fractal.