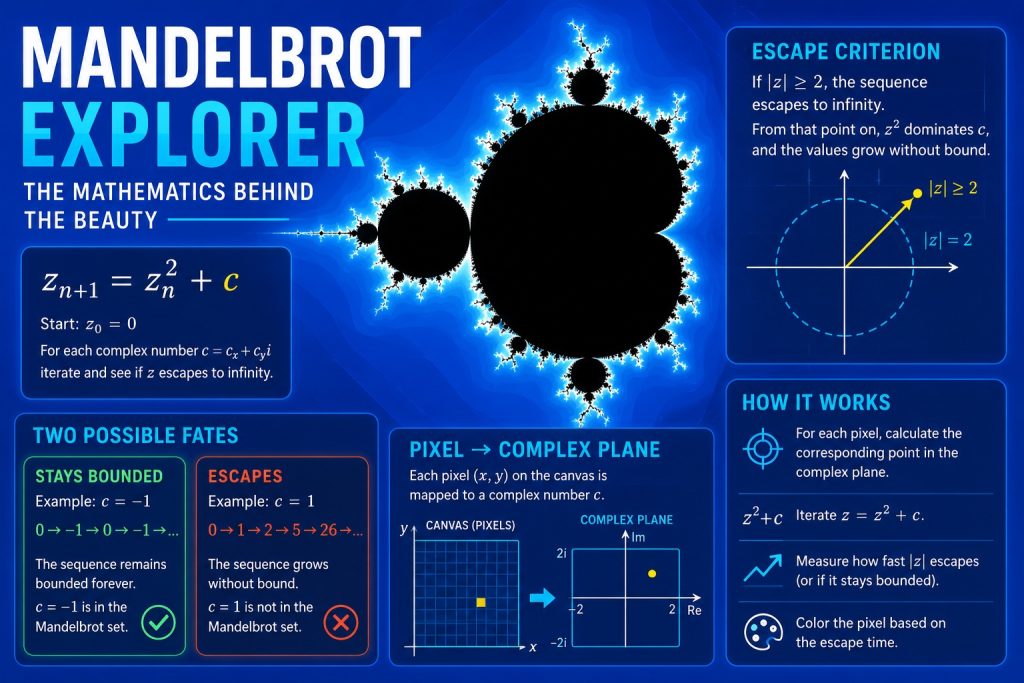
The formula
Pick some complex number c. Start with z = 0. Repeatedly do:
z = z² + cEach time, you get a new value of z. You’re building a sequence: z₀, z₁, z₂, z₃, ...
Two possible fates for this sequence
- It stays bounded : the values of
zwander around but never grow past some fixed size, no matter how many times you repeat the process. - It escapes : the values of
zstart growing, and keep growing, faster and faster, racing off toward infinity.
“Escape” just means fate #2: the numbers blow up and never come back.
Example 1: c = -1 (stays bounded)
z₀ = 0
z₁ = 0² + (-1) = -1
z₂ = (-1)² + (-1) = 0
z₃ = 0² + (-1) = -1
z₄ = (-1)² + (-1) = 0
...
It just bounces between 0 and -1 forever. It never escapes. So c = -1 is in the Mandelbrot set.
Example 2: c = 1 (escapes)
z₀ = 0
z₁ = 0² + 1 = 1
z₂ = 1² + 1 = 2
z₃ = 2² + 1 = 5
z₄ = 5² + 1 = 26
z₅ = 26² + 1 = 677
...
Look at that growth, it’s taking off, and it’ll keep squaring itself into astronomically large numbers forever. This sequence escapes. So c = 1 is not in the Mandelbrot set.
Why the escape criterion (|z| ≥ 2) works
Why exactly 2? For the Mandelbrot iteration, once the magnitude of z becomes greater than 2, the squaring operation dominates the addition of c. From that point onward, each iteration grows larger than the previous one, so the sequence can never return to a bounded region. This mathematical result allows us to stop the calculation as soon as |z| exceeds 2.
The word “escape” is doing a lot of work there without explanation. The word escape simply means that the sequence grows without bound. Nothing is physically escaping. It is just a convenient mathematical term for values that head toward infinity.
Connecting it to the code
while (zx * zx + zy * zy < 4 && i < maxIter) {zx*zx + zy*zy is |z|² (distance of z from zero, squared). The loop keeps iterating as long as z hasn’t escaped yet (distance stays under 2) and we haven’t hit the iteration cap.
The moment |z| crosses 2, the loop stops, that’s the escape being detected. The variable i tells you how many steps it took to escape. A c that escapes almost immediately (i = 2 or 3) gets one color; a c that takes forever to escape (i = 90 out of 100) gets a different color, because it was “close” to staying bounded. If the sequence has still not escaped after maxIter iterations, we assume the point belongs to the Mandelbrot set and color it black. In reality, proving that a point never escapes would require infinitely many iterations, which is impossible. Using a sufficiently large iteration limit provides an excellent approximation.
So the whole picture is really a map of: for every point c, how fast does its z-sequence run away to infinity, if it does at all?
System 1: The canvas pixel grid
The <canvas> is just a grid of pixels. x goes from 0 to canvas.width (left to right), y goes from 0 to canvas.height (top to bottom).
System 2: The complex plane
A complex number c = cx + cy*i can be thought of as a point on a 2D plane, exactly like a point on graph paper. cx (the real part) is the horizontal position, cy (the imaginary part) is the vertical position. The Mandelbrot set lives somewhere in this plane, roughly between -2 and 2 on both axes.
The connection: each pixel is a complex number
Since a complex number is just a 2D point, and a pixel is just a 2D point, you can match them up one-to-one. That’s exactly what this line does:
let cx = (x - canvas.width / 2) / scale + centerX;
let cy = (y - canvas.height / 2) / scale + centerY;
Read it as a translation step:
x - canvas.width / 2— shift pixel coordinates so the middle of the canvas is “0” instead of the top-left corner being “0”/ scale— pixels are big, whole-number steps (0, 1, 2, 3…), but the complex plane near the Mandelbrot set only spans about -2 to 2. So you shrink each pixel step down into a tiny fraction of that range.scalecontrols how much shrinking = your zoom level.+ centerX— shift the whole view to wherever you’ve panned to (if you’re zoomed into some specific region, not the origin)
So this line is literally saying: “pixel (x, y) on my screen corresponds to complex number (cx, cy) on the math plane.”
Then what?
Once you know which complex number c this pixel represents, you run the escape-time iteration (z = z² + c, repeated) using that c. How fast it escapes tells you what color to paint, that pixel, specifically.
Putting it together
for every pixel (x, y):
    figure out which complex number c this pixel represents   ← the mapping line
    run the z = z² + c iteration using that c                 ← the math
    color the pixel based on how fast it escaped              ← the picture
So the canvas is being used as graph paper for the complex plane, one pixel at a time. scale and centerX/centerY are just your “zoom” and “pan”. They control which slice of the infinite complex plane gets mapped onto your finite canvas. That’s also why increasing scale zooms in: it makes each pixel represent an even tinier region of the complex plane, revealing more detail.
That’s one of the most important concepts in the whole Mandelbrot algorithm.
The short answer is:
A pixel does not naturally represent a complex number. We choose to let each pixel represent one point in the complex plane.
Think of it like drawing a map.
Imagine you have a sheet of graph paper. Every point on the paper has an (x, y) coordinate.
Now imagine your computer screen. Every pixel also has an (x, y) coordinate.
Both are just two-dimensional coordinate systems.
For example:
Canvas (pixels)

(0,0) ---------------------> x
  |
  |
  |
  v
  y
The complex plane looks almost identical:
Complex plane

(-2,2)        (2,2)
    +-----------+
    |           |
    |     •     |
    |           |
    +-----------+
(-2,-2)      (2,-2)
The only difference is what the coordinates mean.
On the canvas:
- x and y are pixel positions.
On the complex plane:
- x is the real part.
- y is the imaginary part.
Since both are two-dimensional, we can create a mapping between them.
For example, suppose your canvas is 800 × 600 pixels.
You decide:
left edge     = -2.0
right edge    =  1.0

top           =  1.2
bottom        = -1.2
Now every pixel corresponds to exactly one point in that rectangle.
For example:
Pixel (0,0)
↓

Complex number
-2.0 + 1.2i
The center pixel:
Pixel (400,300)
↓

Complex number
-0.5 + 0i
The bottom-right pixel:
Pixel (800,600)
↓

Complex number
1.0 - 1.2i
This is what the code computes:
let cx = (x - canvas.width / 2) / scale + centerX;
let cy = (y - canvas.height / 2) / scale + centerY;
It says:
“Given this pixel, calculate which complex number it should represent.”
Notice that the arrow only goes one way:
Pixel
   ↓
Complex number
   ↓
Run Mandelbrot iteration
   ↓
Escape time
   ↓
Colour
   ↓
Draw back into the same pixel
So the pixel isn’t a complex number. The pixel is simply a tiny square on your monitor. We associate one complex number with that square so we can ask:
“If this point in the complex plane were used as c, what would happen?”
We repeat that question for every single pixel, and all those answers together form the Mandelbrot image.
A sentence like this is a little more precise than “figure out which complex number this pixel represents”:
For each pixel, calculate the corresponding point in the complex plane. This point becomes the complex number c used in the Mandelbrot iteration.
Escape time (iteration count) is the data. Brightness or color is just one way to visualize that data.