<!DOCTYPE html>
<html lang="en">
<head>
<meta charset="UTF-8">
<meta name="viewport" content="width=device-width, initial-scale=1.0">
<title>ThaiWeather.asia</title>
<link rel="stylesheet" href="styles.css">
</head>
<body>
<header class="header">
  <h1>ThaiWeather.asia</h1>
  <select id="citySelect"></select>
  <button id="refreshButton">Refresh</button>
</header>

<main class="container">
  <section class="current">
    <h2 id="cityHeading">Loading...</h2>
    <div class="temperature">
      <span id="temperatureValue">--</span>°C
    </div>
    <p id="lastUpdated"></p>

    <div class="cards">
      <div class="card">Humidity<br><strong id="humidityValue">--</strong></div>
      <div class="card">Wind<br><strong id="windValue">--</strong></div>
      <div class="card">Pressure<br><strong id="pressureValue">--</strong></div>
      <div class="card">Rain<br><strong id="precipitationValue">--</strong></div>
    </div>
  </section>

  <section>
    <h2>Temperature History</h2>
    <canvas id="temperatureChart"></canvas>
  </section>
</main>

<script src="https://cdn.jsdelivr.net/npm/chart.js"></script>
<script src="app.js"></script>
</body>
</html>
Creating the Weather Dashboard with HTML
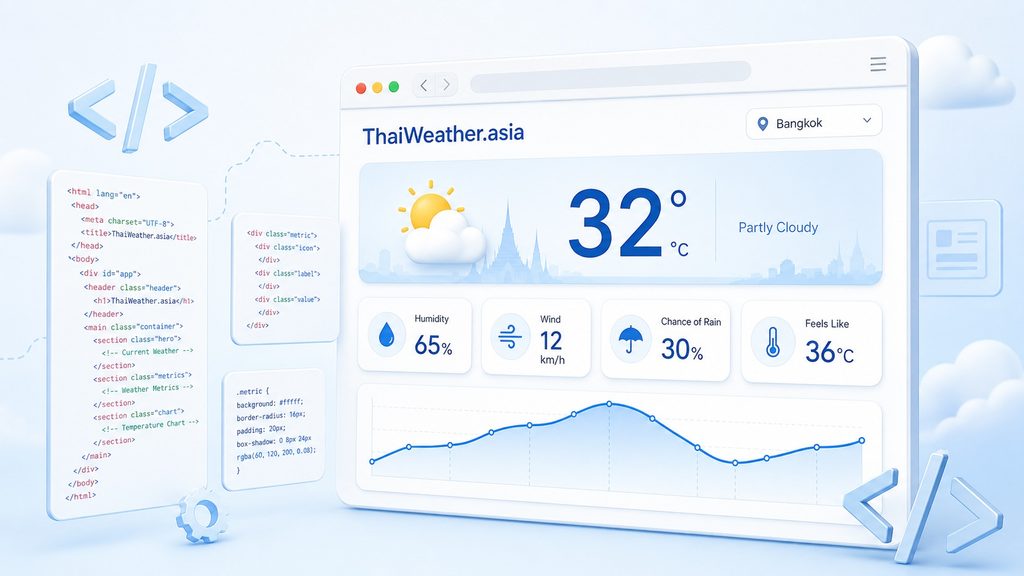
The HTML file creates the visible structure of ThaiWeather.asia. It tells the browser that the page contains a header, a city selector, a Refresh button, current weather information and a temperature history chart.
At this stage, the HTML does not contain actual weather measurements. Instead, it creates placeholders that will later be filled with data retrieved from the ThaiWeather.asia API.
Declaring an HTML5 Document
<!DOCTYPE html>
<html lang="en">
The first line tells the browser that this page uses HTML5, the current standard for structuring web pages. Technically, it is not an HTML element or tag. It is an instruction that prevents the browser from entering quirks mode, where it imitates outdated browser behavior. It should therefore be the first line of every modern HTML page.
The <html> element surrounds the complete document. The lang="en" attribute tells browsers and screen readers that the page is written in English.
Configuring the Page
The <head> section contains information about the page itself.
<head>
  <meta charset="UTF-8">
  <meta name="viewport" content="width=device-width, initial-scale=1.0">
  <title>ThaiWeather.asia</title>
  <link rel="stylesheet" href="styles.css">
</head>
The character set is set to UTF 8, which allows the page to display letters, symbols and special characters correctly. UTF-8 is a character encoding: a system that tells the browser how bytes in the HTML file should be translated into visible characters. Without the correct character encoding, text may appear corrupted. For example:Café → Café. UTF-8 is the standard choice for modern websites. Put this declaration near the beginning of <head> so the browser learns the encoding as early as possible.
The viewport setting ensures that the page uses the available screen width. This is especially important when the website is opened on a smartphone or tablet.
The <title> element defines the text displayed in the browser tab.
The <link> element connects the page to styles.css. The HTML defines which elements exist, while the CSS file determines their colours, spacing, dimensions and layout.
Building the Header
The visible content begins inside the <body> element.
<body>
 <header class="header">
   <h1>ThaiWeather.asia</h1>
   <select id="citySelect"></select>
   <button id="refreshButton">Refresh</button>
 </header>
When you open the website, the header is the first part you see. It contains three elements.
The <h1> displays the name of the website.
The <select> element creates a dropdown list for choosing a city. There are no <option> elements inside it yet, so the list starts empty. The application will request the available cities from the API and insert them into this dropdown.
The button allows you to request the latest weather information without reloading the complete web page.
The city selector and the button both have an id. An ID gives an element a unique name. The JavaScript code can use that name to locate the element and interact with it.
For example, JavaScript can locate refreshButton, listen for a click and then request fresh weather data.
Creating the Main Content Area
<main class="container">The <main> element contains the primary content of the page. In this case, it contains the current weather and the temperature history.
The container class can be used by CSS to control the width, alignment and spacing of this complete area.
An ID normally identifies one specific element for JavaScript. A class can be shared by several elements that should receive the same styling.
Showing the Selected City
<section class="current">
 <h2 id="cityHeading">Loading...</h2>
The first section displays the current weather.
When you initially open the page, the application does not yet know which weather data it can display. You therefore see Loading....
After the data has been retrieved, JavaScript finds the element with the ID cityHeading and replaces Loading... with the selected city name, such as Bangkok.
Displaying the Temperature
<div class="temperature">
  <span id="temperatureValue">--</span>°C
</div>
This block reserves a prominent place for the current temperature.
Before data is available, the page displays --°C. The two dashes indicate that no measurement has been loaded yet.
When the API returns a temperature, JavaScript changes only the content of temperatureValue. If the returned value is 31.4, the browser displays:
31.4°C
The unit does not need to be added by JavaScript because °C is already present in the HTML.
The temperature class can be used to make this measurement larger or more visually prominent.
Showing When the Data Was Updated
<p id="lastUpdated"></p>This paragraph starts empty, so you do not see anything in it when the HTML is first loaded.
After receiving a weather observation, the application can insert a message such as:
Last updated: 22 August 2026 at 14:10 UTCThis tells you how recent the displayed measurement is.
Presenting the Other Measurements
<div class="cards">
  <div class="card">
    Humidity<br>
    <strong id="humidityValue">--</strong>
  </div>

  <div class="card">
    Wind<br>
    <strong id="windValue">--</strong>
  </div>

  <div class="card">
    Pressure<br>
    <strong id="pressureValue">--</strong>
  </div>

  <div class="card">
    Rain<br>
    <strong id="precipitationValue">--</strong>
  </div>
</div>
The dashboard groups humidity, wind, pressure and rain into four separate cards.
The outer cards element keeps the individual cards together. CSS can use this class to place them next to each other on a wide screen and rearrange them on a smaller screen.
Each individual card has the same card class, which gives all four cards a consistent appearance.
The <br> element places the measurement underneath its label. The <strong> element gives the value extra visual emphasis.
Each measurement also has its own unique ID. This allows JavaScript to update the values independently.
For example, if the API returns a humidity of 72 percent, JavaScript can replace the placeholder inside humidityValue while leaving the other elements unchanged.
The HTML is therefore not rebuilt every time new data arrives. Only the relevant values inside the existing page are changed.
Reserving Space for the Chart
<section>
  <h2>Temperature History</h2>
  <canvas id="temperatureChart"></canvas>
</section>
The next section shows the temperature history.
The <canvas> element creates an area in which JavaScript can draw graphics. An empty canvas does not show a chart by itself. It is simply the space that will be used for the chart.
After historical measurements have been retrieved, the application can use their timestamps and temperatures to draw a line chart inside temperatureChart.
As a visitor, you can then see how the temperature changed over time instead of reading a list of individual database records.
Loading Chart.js
<script src="https://cdn.jsdelivr.net/npm/chart.js"></script>Creating a complete chart system manually would require a considerable amount of JavaScript. ThaiWeather.asia therefore uses Chart.js, an existing library designed for creating charts in web pages.
The browser downloads Chart.js from jsDelivr when the page loads. Once the library is available, the application can use it to create the temperature chart.
Loading the ThaiWeather.asia JavaScript
<script src="app.js"></script>The final script loads app.js, which contains the behaviour of the dashboard.
This script can retrieve the cities, load weather observations, react when you choose another city, refresh the current measurements and create the chart.
The order of the two script elements is important. Chart.js must be loaded first because app.js uses it to build the temperature chart.
How the Complete Page Works
When you first open ThaiWeather.asia, the browser performs the following actions:
- It reads the HTML and creates the structure of the dashboard.
- It loads
styles.cssand applies the visual design. - It downloads the Chart.js library.
- It runs
app.js. - The JavaScript requests city and weather data from the API.
- The placeholders in the HTML are replaced with real measurements.
- The historical temperatures are drawn inside the canvas.
The HTML file is therefore the skeleton of the weather dashboard. It defines where everything belongs, but it deliberately contains no fixed weather data. The measurements remain dynamic and can be updated without loading a completely new page.