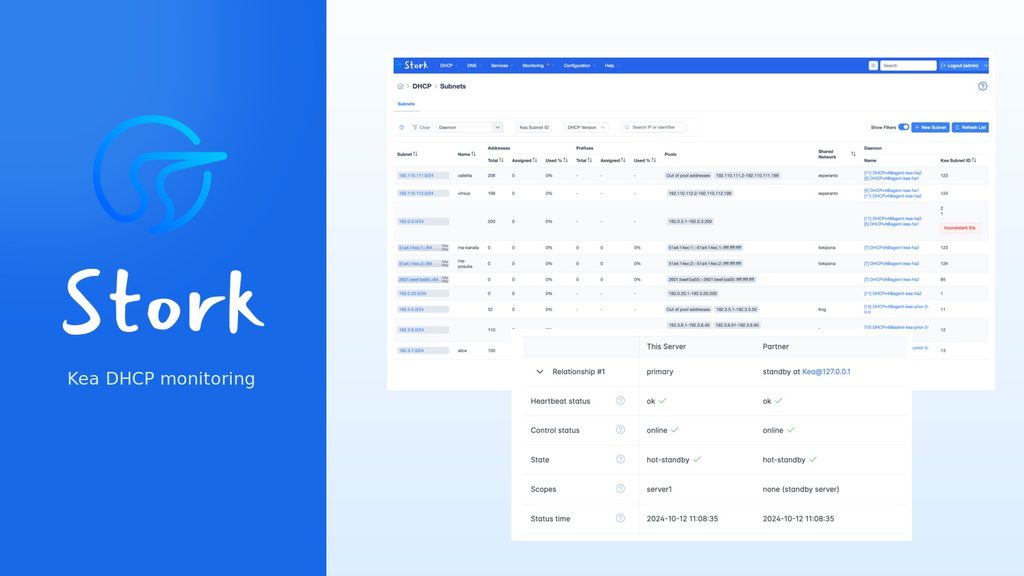
Kea is a modern and flexible DHCP server, but its information is normally spread across configuration files, logs, API responses and statistics. ISC Stork brings that information together in a clear web interface.
This tutorial explains what Stork does, how its components communicate, how to connect it to Kea and how to add email alerts with Prometheus and Grafana.
What is ISC Stork?
ISC Stork is an open source monitoring and management application for Kea DHCP. It provides a central dashboard for Kea servers and makes it easier to inspect their status without repeatedly opening configuration files or running API commands.
Stork can display Kea daemon status, DHCPv4 and DHCPv6 subnets, address pool utilisation, host reservations, lease statistics, software versions and high availability status.
Stork is particularly useful when several DHCP servers are involved. A single dashboard can immediately show whether a daemon is running, whether an HA partner is reachable and whether an address pool is approaching its capacity.
Stork architecture
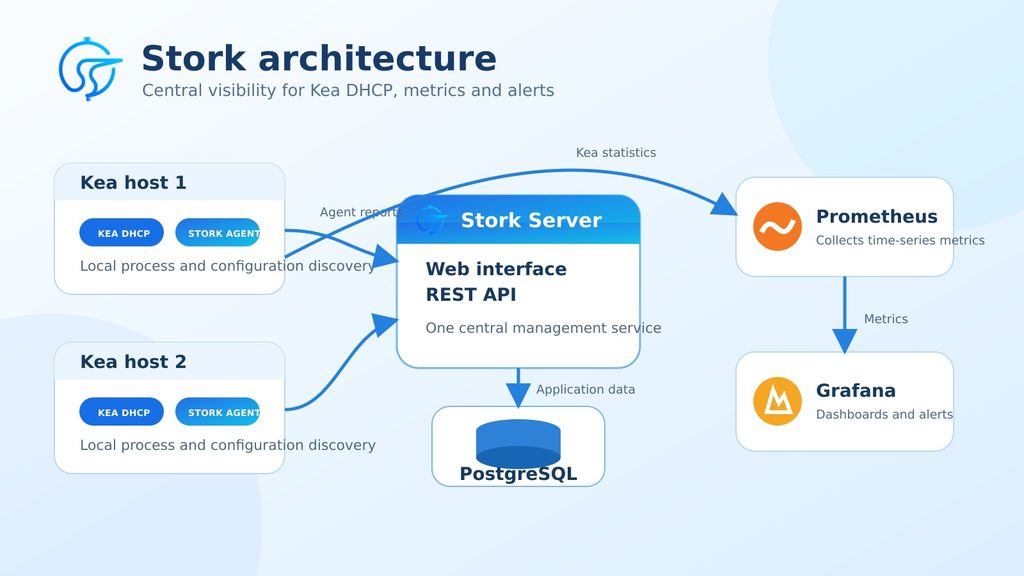
A normal Stork installation contains two components.
The Stork server provides the web interface, REST API and central database. Only one Stork server is normally required.
The Stork agent runs on every machine that hosts a Kea service. It discovers local Kea processes, reads their configuration and communicates with their control interfaces. The agent reports this information to the central Stork server.
The Stork server uses PostgreSQL to store its application data. The agents can also expose Kea statistics in a format that Prometheus understands. Grafana can use those metrics for dashboards and alerts.
Installing Stork
ISC provides packages and instructions for common Linux distributions. The current procedure is available in the Stork installation documentation.
The central machine needs PostgreSQL, the Stork server package and network access to every Stork agent. After installation, check the service:
sudo systemctl status isc-stork-serverThe server commonly exposes its web interface on TCP port 8080.
Install the agent on every server that runs Kea:
sudo systemctl enable --now isc-stork-agent
sudo systemctl status isc-stork-agent
The agent commonly listens on TCP port 8081. The central server must be able to reach that port.
When a new machine appears in Stork, it initially requires authorisation. Open the Machines page, select the unauthorised machine and approve it. Stork should then discover the local Kea daemons.
If no daemon appears, verify both services:
systemctl status isc-kea-dhcp4-server
systemctl status isc-stork-agent
Configuring the Kea control socket
Recent Kea versions can expose an HTTP or HTTPS control interface directly. Stork uses this interface to query the DHCP daemon.
A typical DHCPv4 configuration contains:
"control-sockets": [
  {
    "socket-type": "http",
    "socket-address": "10.0.0.11",
    "socket-port": 8000
  }
]
Port 8000 is the default HTTP control port. Primary and standby servers may both use port 8000 because they have different IP addresses.
The listener address must exist on the local server. Kea will fail to start if it is instructed to bind to an address that is not assigned to an interface.
Validate the configuration before restarting Kea:
sudo kea-dhcp4 -T /etc/kea/kea-dhcp4.confRestart the daemon and confirm its listener:
sudo systemctl restart isc-kea-dhcp4-server
sudo ss -ltnp | grep kea
Testing the Kea API
Test the control interface directly with curl:
curl -sS \
  -H "Content-Type: application/json" \
  -d '{"command":"status-get","service":["dhcp4"]}' \
  http://10.0.0.11:8000/
A successful response contains "result": 0. It also includes the process identifier, uptime, socket status and DHCP state.
When Kea HA is enabled, the response shows the local and remote roles, communication state, clock difference and assigned scopes.
Monitoring a hot standby pair
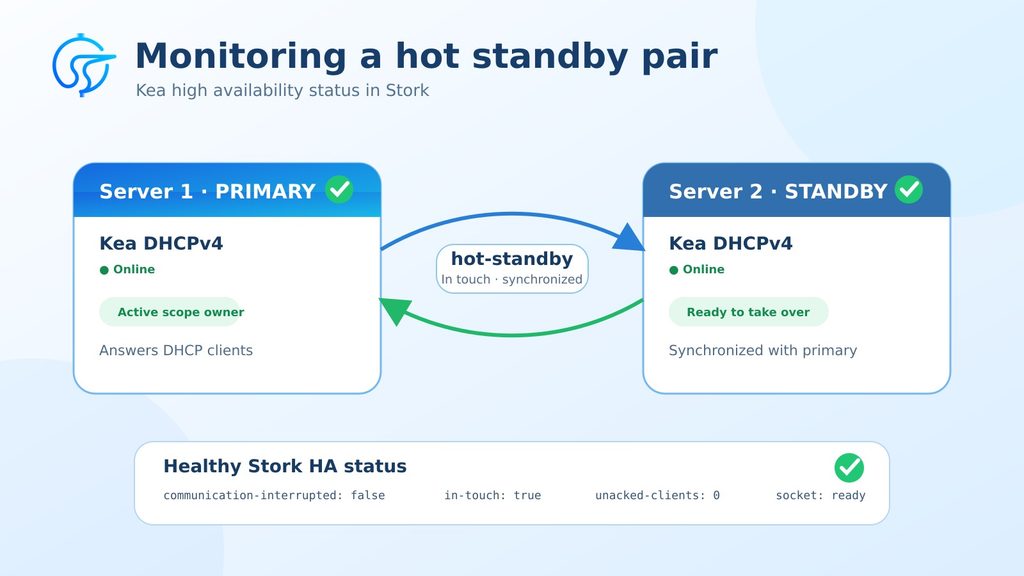
In a hot standby configuration, one server has the primary role and the other has the standby role. The primary normally owns the active scope and answers clients. The standby remains synchronised and ready to take over.
Both rows in Stork may display hot-standby in the HA State column. This is normal. It means both members have entered the healthy operational state of the hot standby relationship.
The green Status symbol indicates that a daemon is online. The HA State column describes the relationship. It does not replace the configured roles.
A healthy API response should report:
communication-interrupted: false
in-touch: true
unacked-clients: 0
socket status: ready
The HA URLs must exactly match the HTTP listeners. For example:
server1: http://10.0.0.11:8000/
server2: http://10.0.0.12:8000/
An incorrect address or port prevents the peers from communicating even when both DHCP services are running.
Adding Grafana email alerts
Stork provides visibility, but an important warning may remain visible only inside its dashboard. Grafana Alerting or Prometheus Alertmanager can provide active notifications.
For service monitoring, Node Exporter provides this metric:
node_systemd_unit_stateThe following query checks whether Kea DHCPv4 is active on one server:
node_systemd_unit_state{
  instance="dhcp1",
  name="isc-kea-dhcp4-server.service",
  state="active"
}
The value is 1 when the service is active and 0 when it is inactive. Create a Grafana alert with this condition:
WHEN QUERY IS BELOW 1Evaluating every minute with a pending period of two minutes is a reasonable starting point. It detects a real failure without immediately reporting a brief planned restart.
Create a separate rule for each DHCP server when clear names and independent notification histories are preferred. Configure No Data as an alerting condition. Otherwise the complete disappearance of a server could produce no metric and no warning.
Useful troubleshooting commands
Check whether Kea is active:
systemctl is-active isc-kea-dhcp4-server.serviceRead recent Kea messages:
sudo journalctl -u isc-kea-dhcp4-server.service -n 50 --no-pagerRead recent Stork agent messages:
sudo journalctl -u isc-stork-agent -n 50 --no-pagerRestart the agent:
sudo systemctl restart isc-stork-agentThese commands help distinguish a stopped Kea daemon, an unreachable control interface and a communication problem between the Stork server and its agent.
Conclusion
ISC Stork gives Kea administrators a much clearer view of their DHCP environment. It combines daemon status, subnet information, pool utilisation, reservations and HA health in one interface.
The strongest setup combines several tools. Kea provides DHCP and redundancy. Stork provides operational visibility. Prometheus stores metrics. Grafana provides historical dashboards and active notifications.
Together, these tools turn DHCP from a background service that is noticed only when it breaks into an observable platform whose health can be checked at any moment.